


Introduction: What is Linear Regression
Linear regression is a statistical technique that is used to model the relationships between dependent variables and one or more independent variables.The linear relationship, which is built by linear regression, gives a brief explanation of the relation between the value of the dependent variable and the values of the independent variable. The value of the dependent variable changes when the value of the independent variable is changed due to the linear relationship between these variables. The mathematical representation of linear regression can be represented as:
 Alpha, Beta = Alpha is the point where the line is the intercept, Beta is the coefficient of Input Variable
Epsilon = That symbol represents the error rate
Y = It represents the target variable which is also called the dependent variable.
X = It represents the predictor variable which is also called an independent variable.
There are many different ways to compute linear regression, but the most common methods to compute relationship coefficients are
Alpha, Beta = Alpha is the point where the line is the intercept, Beta is the coefficient of Input Variable
Epsilon = That symbol represents the error rate
Y = It represents the target variable which is also called the dependent variable.
X = It represents the predictor variable which is also called an independent variable.
There are many different ways to compute linear regression, but the most common methods to compute relationship coefficients are
- Ordinary Least Squares (OLS)
- Gradient Descent
The Ordinary Least Squares Method
The OLS method is a statistical technique that is used to estimate the parameters of a linear regression model. The method is based on the principle of least squares, which states that the best estimate of the parameters is obtained by minimizing the sum of squared residuals. In other words, OLS finds the line of best fit by minimizing the distance between the data points and the line itself. Linear Regression is utilized to build a connection among a dependent variable and one or many independent variables. Smallest Square Error is referred to by the term “least squares”. The other method, such as Generalized and Maximum likelihood, are considered other techniques of OLS.Mathematics of OLS
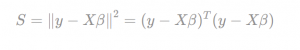
For a dataset with k examples, the OLS method approaches to find optimal coefficients to satisfy the follow equation.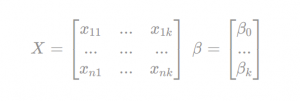 To find the values that minimize the error, we can rewrite the equation as
 Now upon re-arranging the first equation, we can write the following equation to calculate target beta-vector.
 We can see two major products here. First, the product of input matrix with the transpose of this input matrix. Second, the product transpose of input matrix with the dependent variable. Finally the product of these two sub products will result in beta-vector calculation.